There are several different methods used to approximate the area bounded by the function and the x axis. We will be using trapezoids, left endpoint rectangles, right endpoint rectangles, and midpoint rectangles.
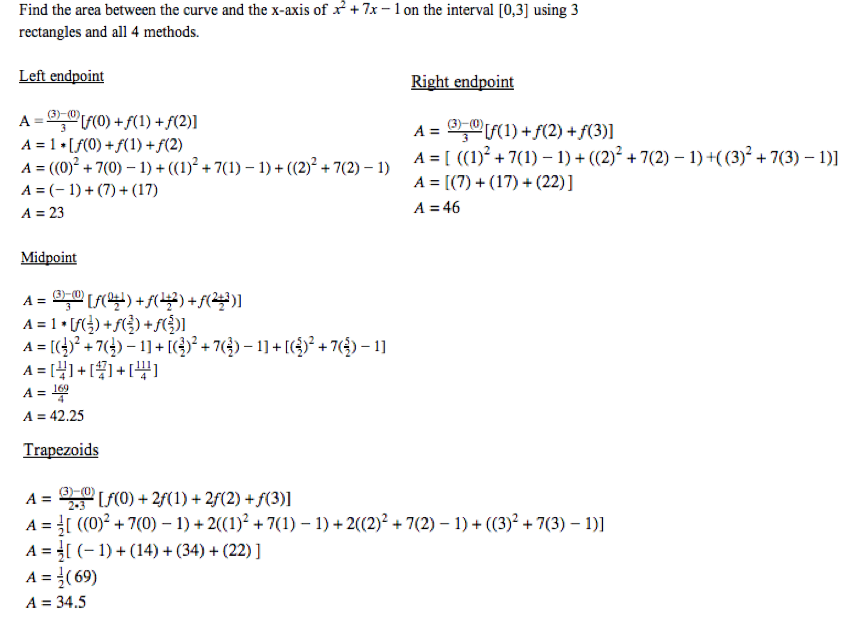
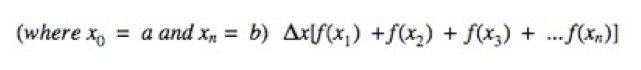
The first we will look at is the trapezoid method. In this method, you must draw in trapezoids along your function, and add together the areas of those trapezoids. Use this formula,
The first we will look at is the trapezoid method. In this method, you must draw in trapezoids along your function, and add together the areas of those trapezoids. Use this formula,

The next method is the left endpoint rectangle method. In this method, you will be able to get the left hand sum. You must start on the left of the function within your boundaries and draw in rectangles that have one corner (the upper left) touching the function. This means the height of the rectangle will be whatever the f(x) value is at that point. Use this formula,

Next, we will look at the right endpoint rectangle method. In this method, you will be able to calculate the right hand sum. You must start on the right of the function within your boundaries and draw in rectangles that have one corner (the upper right) touching the function. This means the height of the rectangle will be whatever the f(x) value is at that point. Use this formula:
Midpoint rectangles are the last method we will use. To use mid- point rectangles, you must use the point directly in the middle of your in- terval. For example, since our interval is 1, the first midpoint rectangle would touch the function at f(.5). Then, you must find the height of each rectangle by adding up the x values it is in between and dividing by two. Adding together all of the areas of your rectangles will give you an ap- proximated area. Use this formula