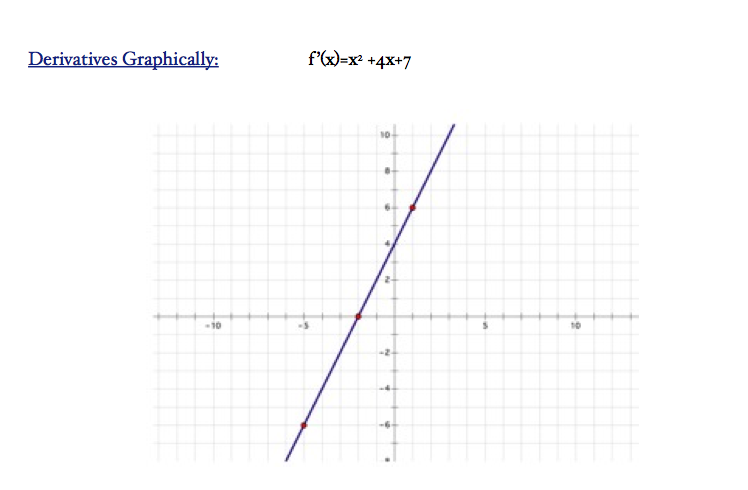
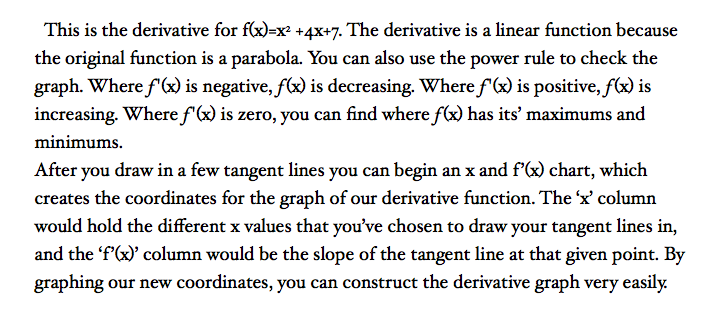
Derivative functions are not just represented with equations, but also by graphs. The number of turns that the derivative function has will always be one less than the number of turns that the original function has.
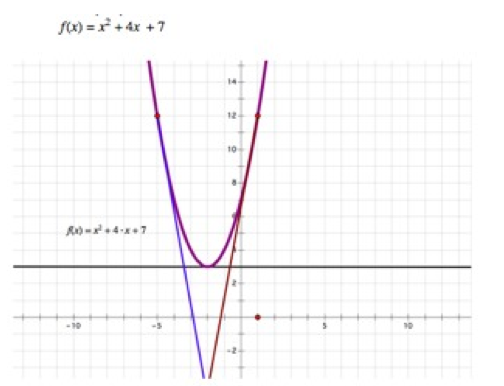
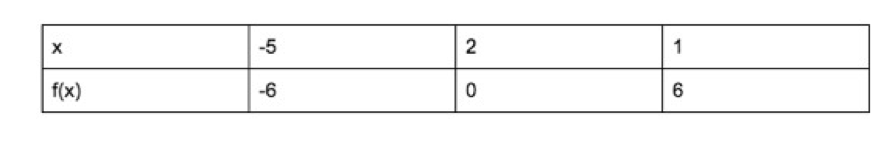
In this graph f(x)=x2 +4x+7, the equation is a parabola meaning that there is only one peak. In this function, the lowest peak is when x=-2, and the derivative is 0. Knowing that, you must try to find slopes around the 0. For example,x= -5 and x= 1.
For x= -5, f’(x) is about -6 and for x=1, f'(x) is about 6 too. You know this by looking at the tangent line you’ve drawn at the point, and by counting up or down however many units until you reach another point.
(In this case, 6 would be the slope of the tangent line)
he graphs are always going to be an estimate. You can see that the slope is about 6.
If you are not given the equation of the original function, you must find the derivative by graphing and using tangent lines. Tangent lines are drawn into graphs to represent the slope at a certain point. You must use several tangent lines, but this method will always be an approximation.
This process starts by choosing an x value on the graph of your original function, looking at where the function crosses that x value, and drawing in a tangent line. Then you must approximate to find the slope of that tangent line. * Recall, we know that the slope of that tangent line is the derivative value for the x value.
You must repeat this step several times for different x values until you gather enough data to sketch the derivative function.
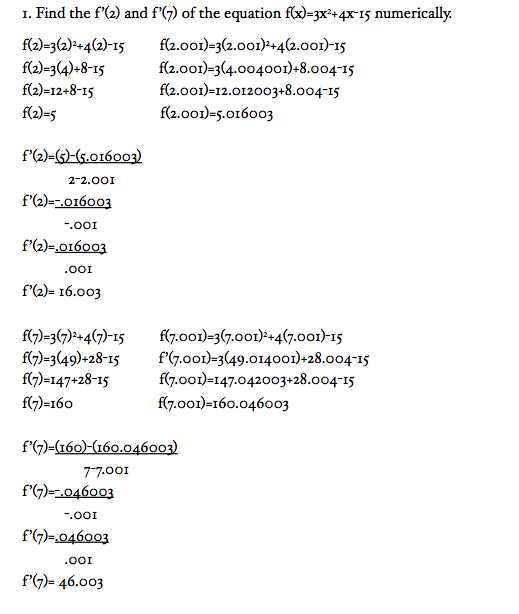
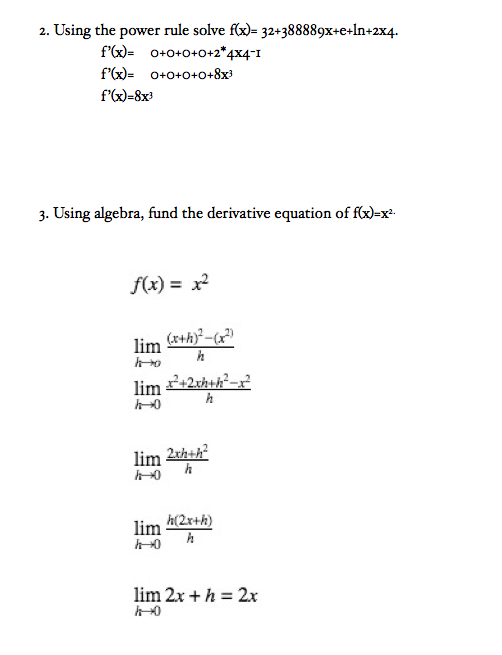
Examples of practicing derivatives: